Two YouTube videos about procrastination drew very different crowds. One was a psychiatrist’s, where people talk about ADHD, autism, and the small failures of a hard week. The other was a programmer’s, dry and technical, where the same subject arrives dressed as a productivity hack. Between them they left 1,006 comments about focus, shame, and the tricks people use to get through the day.
I wanted to know what a machine could tell me about the mood of those two rooms without me reading every line, because that is the job a communications team actually has. You inherit a comment section, or a survey, or a month of mentions, and someone wants to know how the audience feels. The quick answer is sentiment analysis, and it is where I started. It is not where the useful part turned out to be.
The number, and where it wobbles
I ran two off-the-shelf sentiment tools over all 1,006 comments. VADER and TextBlob each take a line of text and return a number for how positive or negative it is. They agreed on the direction of a comment about 72 per cent of the time, which sounds reassuring until you look at the quarter where they split, and at which room they split in. They disagreed on 170 of the 503 comments under the psychiatrist and 108 of the 503 under the programmer. The rawer and more personal the writing, the less two machines could agree on what they were hearing.
To see which one to believe, I pulled 40 comments where the tools flatly contradicted each other, 20 from each video, and coded every one by hand as positive, neutral, or negative. These were the hard cases by design, so the scores are not a general accuracy rate. On those forty, VADER matched my read half the time and TextBlob under a quarter. The difference is mechanical. VADER counts the exclamation mark, the block capitals, the emoji, and TextBlob reads past them to the dictionary words underneath. When a comment opened on a hard admission and closed with “Thank you, Dr. K! ❤”, VADER caught the gratitude and TextBlob, dropping the heart, called it negative.
That sensitivity is also how VADER goes wrong. Given a long comment weighing how autistic children learn speech by copying cartoon characters, careful and unresolved, with no praise or blame anywhere in it, VADER counted the modifiers stacked after “but” and “because” and scored it firmly positive. A person reads it as someone thinking out loud. The tool heard a verdict in a comment that never reached one. It counts marks on a page. It has no idea what the comment is about.
That last line is the whole problem, and no amount of tuning fixes it. Suppose the sentiment number were perfect. It would still only tell me the average temperature of a room. It would not tell me what the room was talking about, and for a communications read that is the question that matters.
Clustering the conversation
So I stopped averaging and started grouping. Sorting the comments into topic clusters turns one mood into a map of what people came to say, and the map looks nothing like the single number.
The programmer’s video was not one conversation. It was eight, with a scatter of comments that never grouped into any of them. The largest cluster, 160 of the 503 comments, was straightforward praise for the video. But underneath it sat a run of much harder threads: 77 comments on ADHD and autism social coping and frustration, 75 more on self-disclosure and diagnosis, 56 on troubleshooting mental health with apps and systems. There were small human seams too, the kind a word count would never surface. A cluster of eleven comments was an in-joke about a piano teacher. Another twelve were riffing on “eat the frog”. The comment section had a texture, and clustering is what let me see it.
The sentiment per cluster is where the averaging did its damage. The programmer’s video scored a warm 0.50 overall on VADER. That number is carried almost entirely by the people praising the video, at 0.59, and by the lighter clusters like hydration tips. The ADHD and coping conversation, the one a mental-health communicator would most want to hear, sits at 0.34, well below the headline and far quieter than the room’s average suggests. Blend those threads into one score and you erase exactly the group you were trying to listen to.
The psychiatrist’s video ran the same way. Its biggest thread by a distance, 224 of 503 comments, was the actual working-through of procrastination and perfectionism, and it scored a middling 0.31. The warmth in the top-line number came from a separate cluster of 83 comments thanking and discussing the host, at 0.50. Two very different rooms, the workshop and the fan mail, folded into one average that described neither. The quips cluster, cooler still at 0.14, dragged in the other direction. A single mood figure is a blend of conversations that were never having the same feeling.
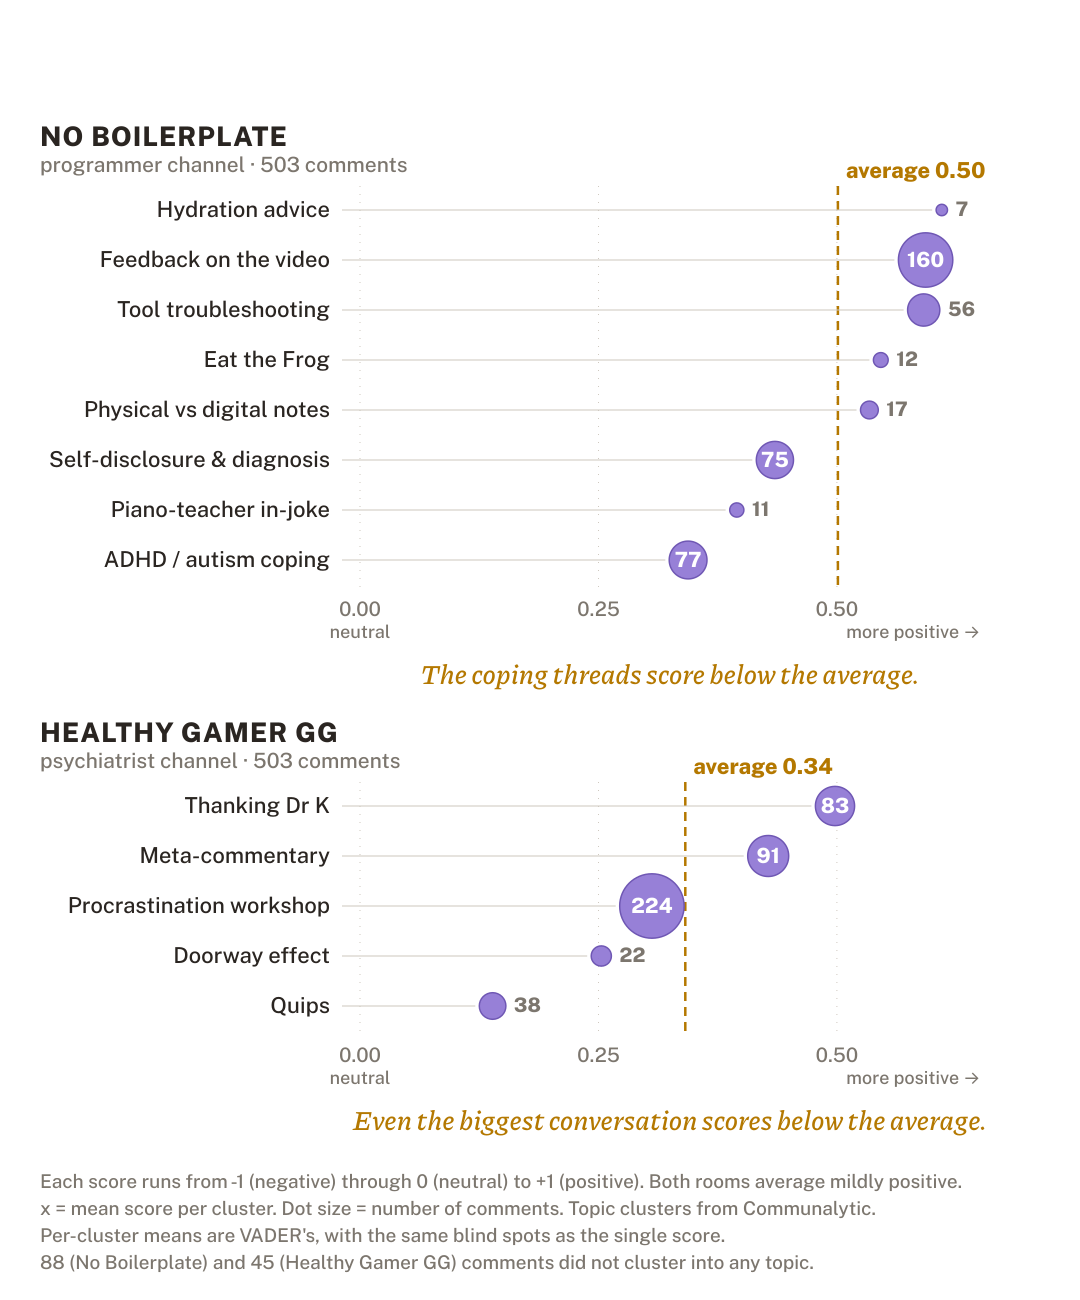
None of these per-cluster figures escape VADER’s blind spots. They are still its numbers, with all the misreadings above baked in. What clustering changes is that the tool stops pretending the room has one mood. Broken out by topic, even a flawed score admits that a comment section is several conversations at once, and it points you at the ones worth reading closely.
Reading the room
Sentiment analysis is a good place to start and a bad place to stop. It is fast, it scales, and it will give you a defensible-looking number for a feeling. It will also hand you a cheerful average for a thread full of people quietly struggling, and it cannot tell you the difference between a room praising a video and a room working through a diagnosis.
The clusters can. Reading them is slower and closer to editing than to counting, because it means going back to what people actually wrote and grouping it by what they meant. That is the part a communications job turns on. The score tells you the temperature. The conversation is the thing you were hired to understand, and you only get to it by reading.
Comments collected from two public YouTube videos and scored on Communalytic, which also produced the topic clusters. All figures reproduced from the underlying data. Sentiment tools: VADER (Hutto and Gilbert, 2014) and TextBlob.